TCD political science on a par with "best of Britain";
Michael Marsh and I have just finalized our comparative assessment of the research output an impact of political studies scholars in Ireland. This exercise compares citation measures for all permanent, full-time academic staff in eight Irish politics departments (in the Republic and in Northern Ireland). That paper can be found here and earlier discussions during the drafting of this paper feature elsewhere on this blog.
As a benchmark we also compared the Irish departments to the Department of Government at the University of Essex. As Essex is considered by many to be the best politics department in Britain and received the maximum score of 6* in the last RAE, using this department for a reference is setting the bar quite high. In addition, with 25 full-time, permanent staff, Essex’s department is also larger than all of the Irish departments in our study except Queen’s.
We found in our analysis that in per capita terms, Essex was ahead of TCD, but just barely, with 103.5% of TCD’s score. Its score is also higher on articles, but again not by much, at 117.8%. On Google Scholar-based measures, TCD is actually higher per capita than Essex: almost 2 Google cites/year higher than Essex. TCD also had a higher Google citation score than Essex when these figures were produced by divided by the total years of all staff members by the sum of all of their Google citations. Finally, TCD’s total per capita Google citations were also higher by about 22 citations per capita.
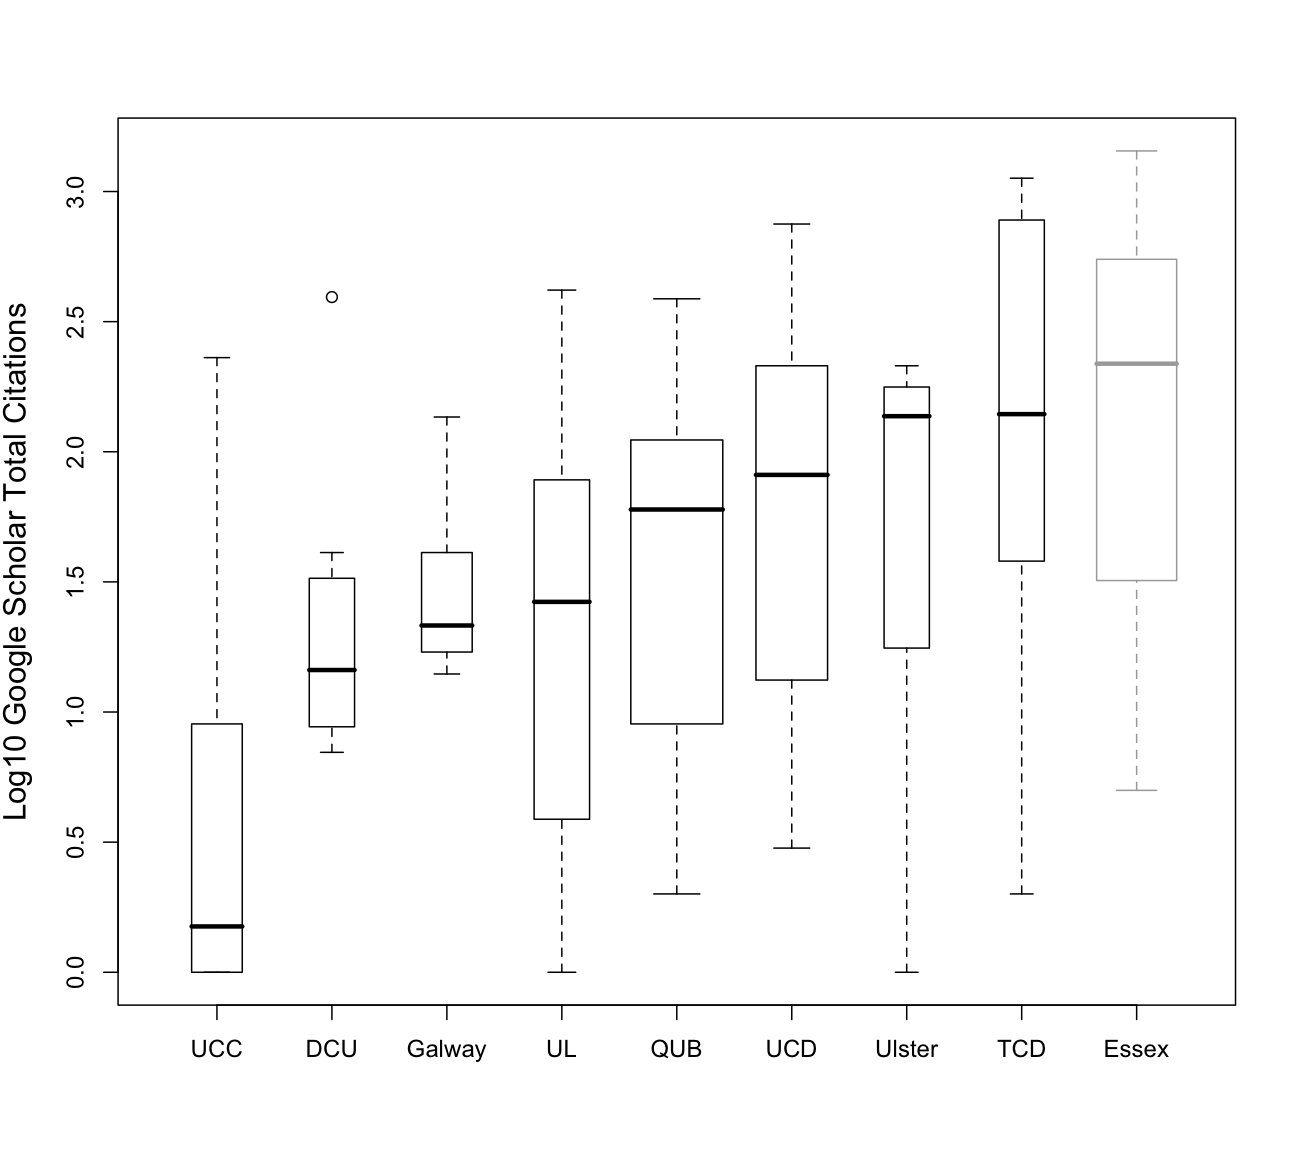
Boxplot of overall impact by department, measured as total Google citations
Differences between departmental profiles can be summarized graphically using box plots such as the one above. Each box shows the inter-quartile range of the values for each department, along with a bar for the median value and additional markings outside the box showing some of the extreme values. For comparison, we have also plotted the distribution of Essex’s department of government. While Essex’s median total citations is higher than any Irish department’s, its interquartile range is slightly below TCD’s. The above figure plots this data for the total Google Scholar citations, a figure that takes into account every type of publication. Departments are plotting in increasing order, and the counts shown on the y-axis are logged to reduce skew. In comparison with Essex, TCD has practically the same median value on productivity, with a slightly larger range.
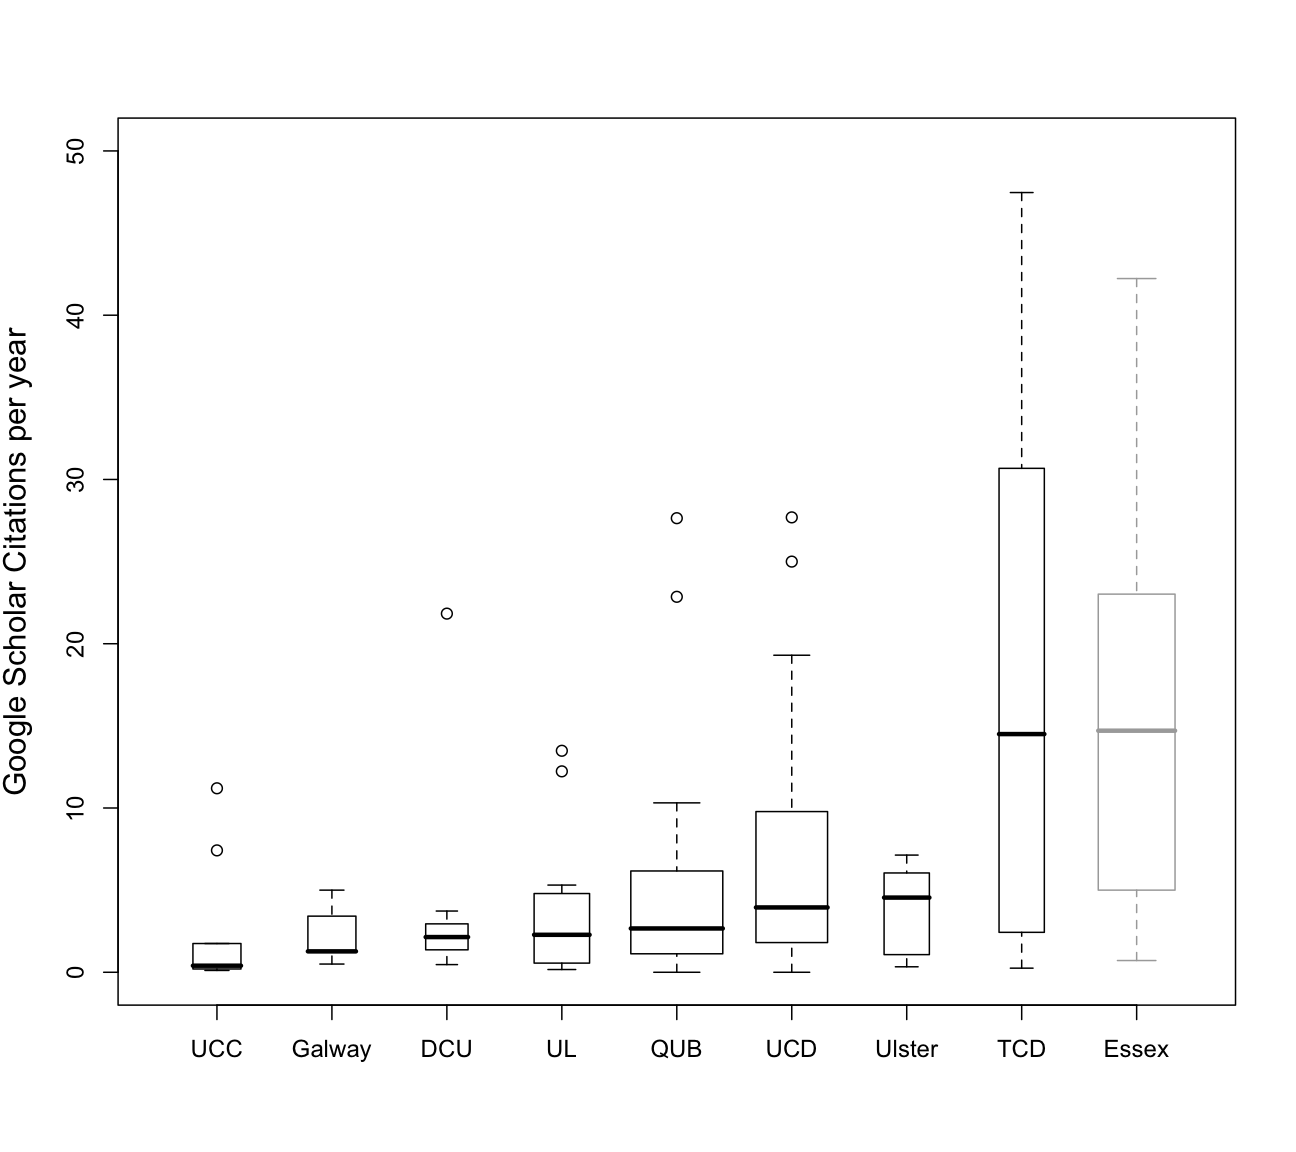
Boxplot of productivity by department, measured as Google Citations/year
Different departments not only have different numbers of staff, they also have very different age profiles. Counting total citations clearly advantages departments with senior staff whose longer careers have provided more opportunity to accumulate citations. In the second box plot, we portray the profiles of departments according to productivity, on a linear scale, according to the Google Scholar citations per year. Essex, shown in gray, has a median that is all but indistinguishable from Trinity’s.

